参考资料:
https://yanfengliux.medium.com/the-confusing-metrics-of-ap-and-map-for-object-detection-3113ba0386ef
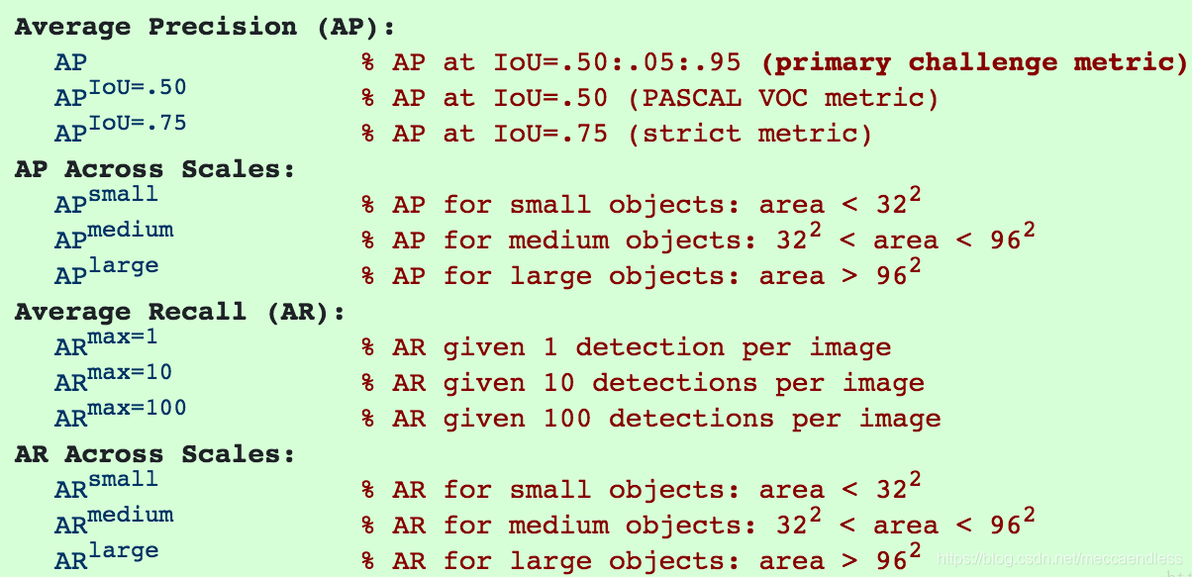
COCO训练数据结果给了一个较为复杂的表格:
Evaluate annotation type *bbox*
DONE (t=0.04s).
Accumulating evaluation results...
DONE (t=0.01s).
 Average Precision  (AP) @[ IoU=0.50:0.95 | area=   all | maxDets=100 ] = 0.621
 Average Precision  (AP) @[ IoU=0.50      | area=   all | maxDets=1000 ] = 0.970
 Average Precision  (AP) @[ IoU=0.75      | area=   all | maxDets=1000 ] = 0.730
 Average Precision  (AP) @[ IoU=0.50:0.95 | area= small | maxDets=1000 ] = 0.575
 Average Precision  (AP) @[ IoU=0.50:0.95 | area=medium | maxDets=1000 ] = 0.725
 Average Precision  (AP) @[ IoU=0.50:0.95 | area= large | maxDets=1000 ] = 0.575
 Average Recall     (AR) @[ IoU=0.50:0.95 | area=   all | maxDets=100 ] = 0.676
 Average Recall     (AR) @[ IoU=0.50:0.95 | area=   all | maxDets=300 ] = 0.676
 Average Recall     (AR) @[ IoU=0.50:0.95 | area=   all | maxDets=1000 ] = 0.676
 Average Recall     (AR) @[ IoU=0.50:0.95 | area= small | maxDets=1000 ] = 0.634
 Average Recall     (AR) @[ IoU=0.50:0.95 | area=medium | maxDets=1000 ] = 0.773
 Average Recall     (AR) @[ IoU=0.50:0.95 | area= large | maxDets=1000 ] = 0.660
OrderedDict([('bbox_mAP', 0.621), ('bbox_mAP_50', 0.97), ('bbox_mAP_75', 0.73), ('bbox_mAP_s', 0.575), ('bbox_mAP_m', 0.725), ('bbox_mAP_l', 0.575), ('bbox_mAP_copypaste', '0.621 0.970 0.730 0.575 0.725 0.575')])
解释一下表格中的含义:
【0】预测结果可能的情况
TF表示预测是否正确,PN表示预测结果的正负。
P=(TP)/(TP+FP)
R=(TP)/(TP+FN)
精度P是衡量在所有预测中正确预测的百分比;召回率R是衡量现实中所有正面案例中正确正面预测的百分比。
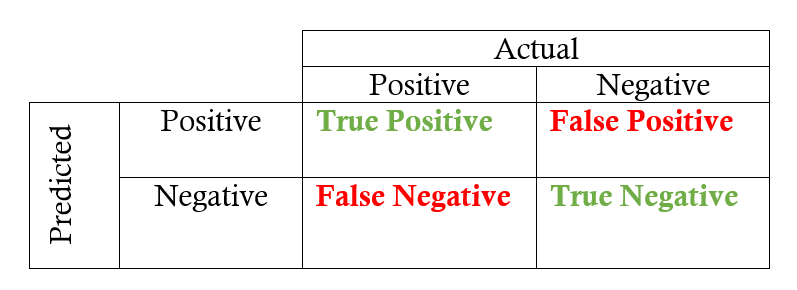
TP,FP,FN,TN
【1】AP,AR
AP:PR曲线下的面积
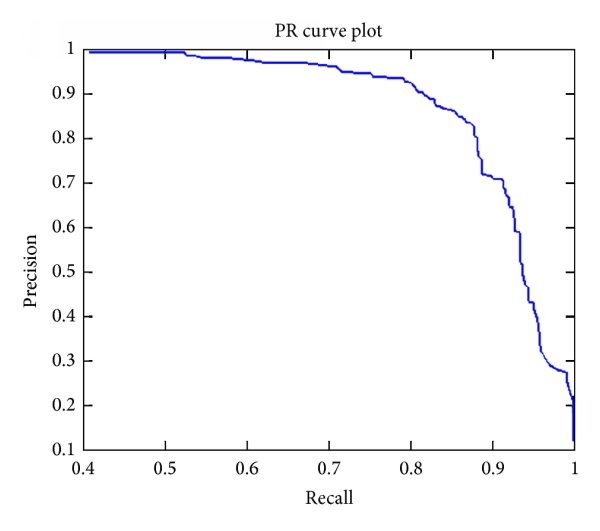
PR曲线
AR:是衡量一个模型检测框定位是否准确的指标。

AR是IoU在[0.5, 1.0]上所有recall的平均。
Average recall describes the area doubled under the Recall x IoU curve. The Recall x IoU curve plots recall results for each IoU threshold where IoU ∈ [0.5,1.0], with IoU thresholds on the x-axis and recall on the y-axis.

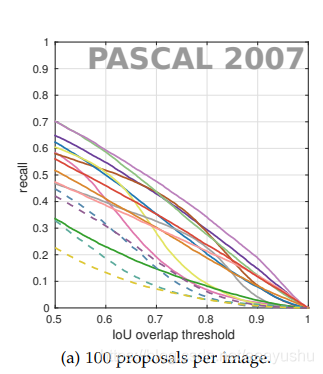
Recall-IoU曲线
AR是由What makes for effective detection proposals? (https://arxiv.org/pdf/1502.05082.pdf)这篇文章提出 具体的代码实现为(https://github.com/hosang/detection-proposals/blob/master/recall/compute_average_recall.m):
参考这篇:https://manalelaidouni.github.io/Evaluating-Object-Detection-Models-Guide-to-Performance-Metrics.html
https://blog.csdn.net/aaayushu/article/details/106236370
【2】IoU
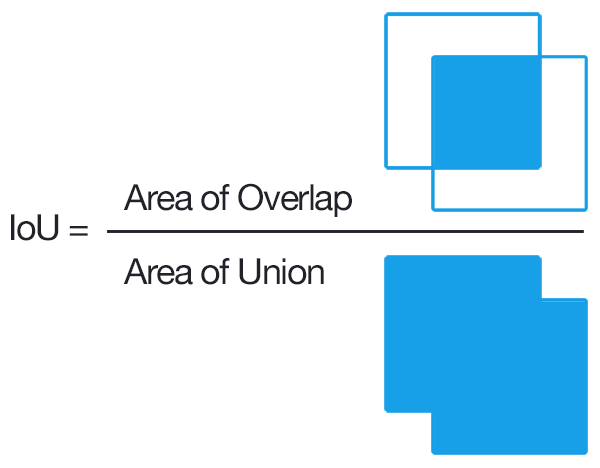
传统理解为,IoU大于50%的时候,认为是目标检测到了。
为了更细化区分网络的性能,COCO数据集的评价标准中,把IoU的值从50%到95%每隔5%进行了一次划分。
具体来说,0.5 0.55 0.6 0.65 0.7 0.75 0.8 0.85 0.9 0.95 ,一共十个,每次测试的时候都是在IoU=这个数上测试的。
在这10组precision-recall对中,我们对这十个值取平均(我理解为,10个PR曲线下得到的AP值,然后对这10个AP进行平均),得到了一个AP@[0.5:0.95]
有时固定IoU的阈值,比如50%或75%,也就是AP50和AP75,意味着IoU为50%或者75%时的AP值。
·我们为什么要在不同的IoU情况下求AP和AR?
方便模型进行惩罚差的结果,优化好的结果。
【3】mAP:不同类别的AP求平均值 【4】COCO的图像大小衡量标准:
https://blog.csdn.net/meccaendless/article/details/87176932